Subscribe to Forta’s News
Stay updated on the latest Forta news and announcements.
Thank you! Your submission has been received!
Oops! Something went wrong while submitting the form.
Forta maps every direct and indirect dependency as a graph, quantifies their exposure and keeps it current block after block.
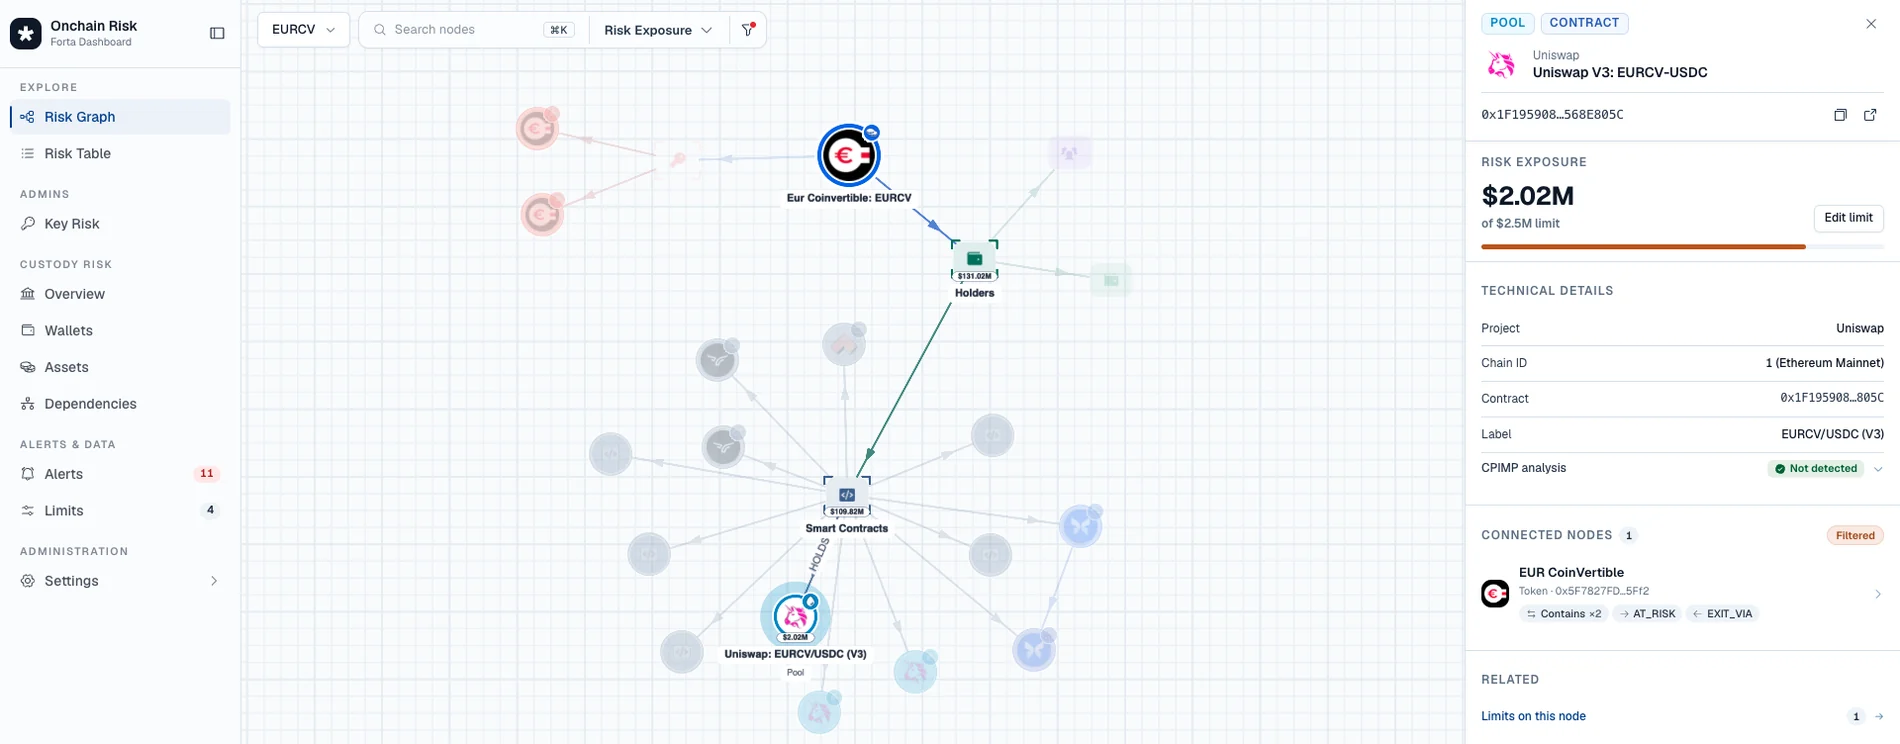
Select any node to see its attribution, owners, USD exposure against your limit, and the dependency path that connects it to your position.
Hundreds of thousands of labels resolve each node to the protocol, admin, or wallet behind it, with your own private labels overlaid on top.
Set exposure thresholds. Forta alerts on breach and shows the dependency path that caused it.
Admin changes, proxy upgrades, new collateral, large movements, concentration spikes, depegs, liquidity crunches, mints and burns. Delivered by email, webhook or alert feed.
Forta's proprietary detection catches exploits in real time, and the graph tells you instantly how much of your exposure sits behind the affected entity.
The same graph and the same alerts, available three ways.
Interactive graph, risk tables, node detail and a filterable alert feed. CSV and PDF export for committee and regulatory reporting.
REST endpoints for the graph, exposure metrics and alerts, plus signed webhooks so events land in your existing systems.
Connect Forta to Claude, ChatGPT or your own internal agents and ask questions in plain language, answered against the live graph. No query language to learn.